Web analytics reports
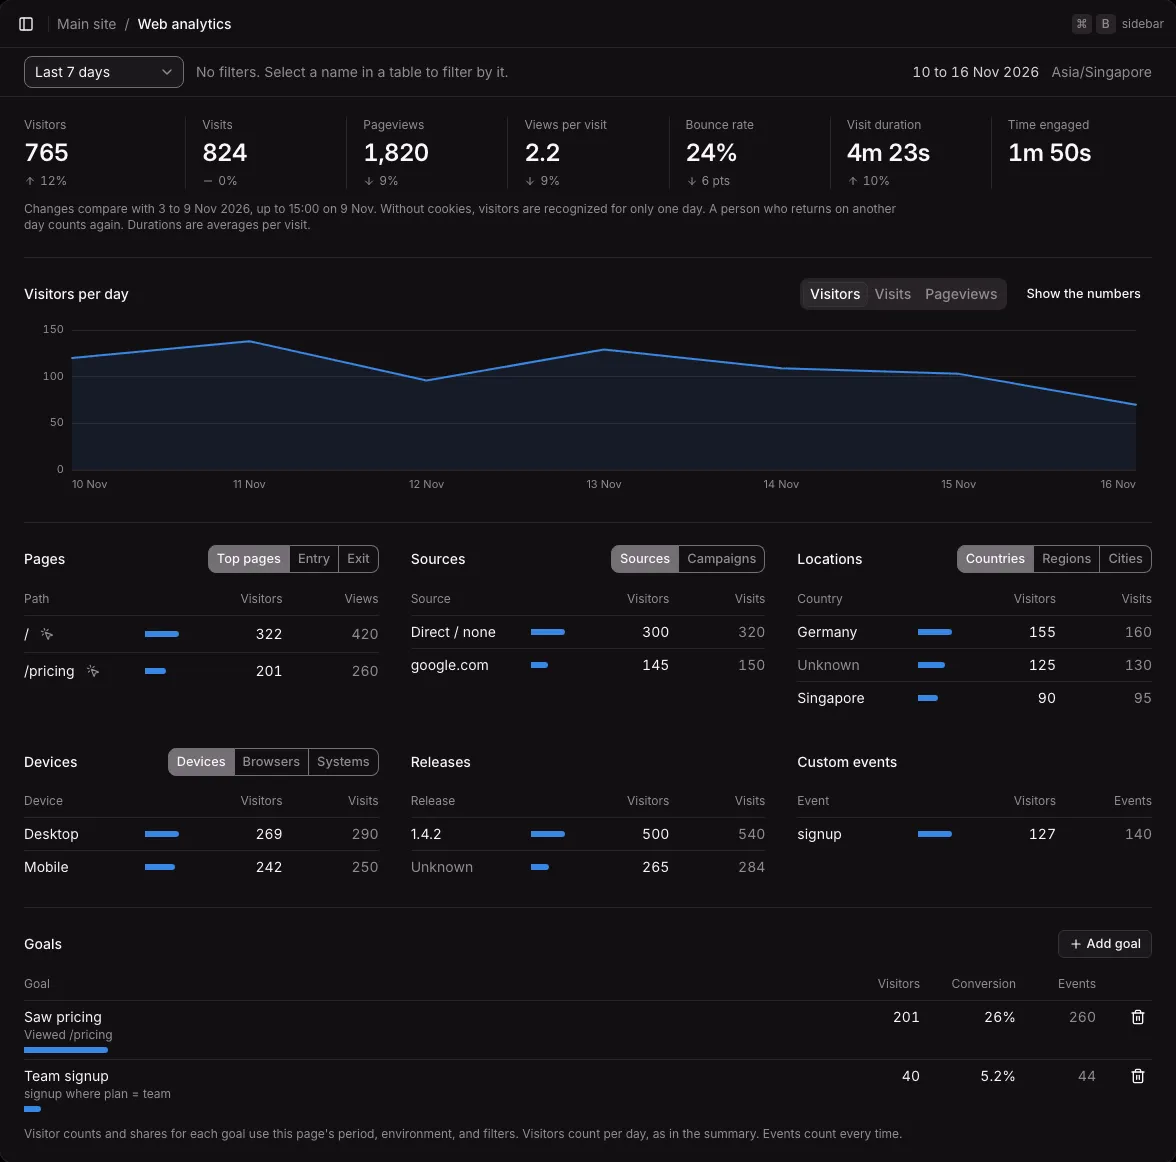
Open a project, then Web analytics in its menu. The page shows what the tracker recorded on your site for one period: how many people came, where they came from, and what they looked at. Every number is computed from the stored events when you open the page, and the page loads its data again every minute while it is open.
The page is a report, laid out as the other reports are: the filter bar at the top, a row of figures, a chart, then tables. See Reports for the parts all reports share.
To see this page, a member needs the web analytics area. The Goals table at the bottom needs the product analytics area too. See Members and roles.
The filter bar
Section titled “The filter bar”- The period: Today, Last 7 days (the default), Last 30 days, Last 90 days, Last 12 months, or “Custom range…” for days you choose. A custom range covers at most 366 days.
- The environment: a second picker shows once another environment than
productionhas events in the period. See Environments and releases. - The filters: the active filters, or a line that says how to add one.
- The days and the timezone: the days the page covers, such as “10 to 16 Nov 2026”, and the instance’s timezone.
Days in the instance’s timezone
Section titled “Days in the instance’s timezone”A report covers whole days in the instance’s timezone, not in your browser’s. The owner sets the timezone in the instance’s Settings. A day that is 23 or 25 hours long, when clocks change for daylight saving, counts correctly. Days without data show as zero.
The last day of a period that ends today is not over yet. An event can also arrive up to 24 hours after it happened, and the report places it when it happened, so a recent day can still grow a little.
Custom range
Section titled “Custom range”“Custom range…” opens a dialog with the first and last day. Click the first day in the calendar, then the last. You can also type the days, day first (DD/MM/YYYY). The fields add the slashes for you. A custom range keeps your filters. Choosing a preset period again removes them.
The figures
Section titled “The figures”| Figure | What it counts |
|---|---|
| Visitors | Distinct visitors. A visitor is recognized for one day only, so a person who comes on 3 days counts 3 times. |
| Visits | Visits that started in the period. A visit ends after 30 minutes without an event. |
| Pageviews | Pages viewed. A change only to the query string or the fragment is not a new pageview. |
| Views per visit | Pageviews in those visits, divided by the visits. |
| Bounce rate | The share of visits with one pageview and no custom event. A long read of one page is still a bounce. |
| Visit duration | The average time from a visit’s first event to its last. A bounce counts as 0 seconds unless the page reported how long it was visible. |
| Time engaged | The average time per visit that pages were visible. Time in a background tab or with the phone locked does not count. |
Visitors and pageviews count the events in the period. Visits, the bounce rate, and the durations count the visits that started in it. A visit from 23:50 to 00:20 counts on the first day, while its pageview at 00:05 counts on the second.
Ottertrail sets no cookies, so it tells visitors apart by a daily ID. The count is an estimate: one person counts twice when their address changes during the day (a phone that moves from Wi-Fi to mobile data, a VPN), and several people count once when they share an address and the same browser version. A visit in progress at midnight counts as two visits.
Definitions of a bounce differ between tools, so bounce rates from different tools are not comparable.
The change from the period before
Section titled “The change from the period before”Under each figure, an arrow and a size show its change from the period right before: as many days, in the same timezone, with the same filters. The bounce rate changes in points (“6 pts”), the others in percent (“12%”).
- A period that is still running is compared up to the same moment of the period before. At 15:00, the last 7 days are compared with the 7 days before them up to 15:00 on their last day. The note under the figures names the days compared and that time.
- A change shows only when the counts reach 20 in either period. With fewer, a percentage would mislead.
- “New” means the period before had none.
- The arrows are not colored. Up is not always better: a higher bounce rate is worse.
Only the figures are compared. The chart and the tables show the current period only.
The chart
Section titled “The chart”The chart shows visitors per day. Choose Visits or Pageviews beside its title to show those instead. Hover over the chart to see all three numbers for the nearest day. “Show the numbers” opens the same data as a table. A one-day period draws no line.
With the keyboard, Tab moves to the chart, and the arrow keys, Home, and End move between days. A screen reader reads each day with its three numbers.
The tables
Section titled “The tables”The tables list the most visitors first, with a bar for each row’s visitors. Some have buttons in their header that switch the list.
| Table | Lists |
|---|---|
| Pages | Top pages (views and visitors per path), Entry (the first page of each visit), and Exit (the last page) |
| Sources | Sources, and Campaigns (the utm_campaign tag) |
| Locations | Countries, Regions, and Cities |
| Devices | Devices, Browsers, and Systems (operating systems) |
| Releases | The release of each visit’s first event. See Environments and releases. |
| Custom events | Each event that your site sends with track(), its visitors, and how often it happened. See Custom events. |
| Goals | Each goal’s visitors, conversion, and events. See Goals. |
In the Pages table, each path has a small heatmap icon after it, named “Heatmap of” and the path. It opens the page’s heatmap for the same period and environment. Selecting the path itself still filters this page.
Each table shows its first 10 rows. When it shows all 10, “Show all” opens the whole list in a dialog: 50 rows at a time, “Load more” for the next, and a search by name. A missing value, such as a visit without a location, shows as “Unknown”. A visit without a campaign shows as “No campaign”.
Sources
Section titled “Sources”A visit’s source is the first of these that exists:
- The
utm_sourcetag of the page’s address, such as?utm_source=newsletter. - The referring site’s hostname without
www.: a link fromhttps://www.google.com/searchcounts asgoogle.com. An Android app sends its package name, such ascom.google.android.gm. - “Direct / none”: no referrer, as with a typed address, a bookmark, or an app that sends none.
A referrer on one of the project’s own allowed sites is not a source. It means the visit began on a page of your own site, such as a tab left open for more than 30 minutes, so it counts as direct.
The five UTM tags (utm_source, utm_medium, utm_campaign, utm_term, utm_content) are the only parts of the query string that Ottertrail keeps. The rest of the query string, and the fragment, never reach the reports.
Locations and devices
Section titled “Locations and devices”The country, region, and city come from the visitor’s IP address, looked up on your instance when the event arrives. The address itself is never stored. A country is close to a fact. Regions and cities are estimates: mobile networks, VPNs, and iCloud Private Relay show where traffic leaves the network, not where the person is. A region or city keeps its country, such as “Springfield, US”, because the same names exist in several countries.
The browser, operating system, and device come from the browser’s User-Agent. Only the operating system’s name and the browser’s major version are kept, because browsers now report fixed versions. An iPad that presents itself as a Mac counts as a tablet when it reports a touchscreen.
Filters
Section titled “Filters”Select a name in any table to filter the page by it: a source, a country, a page, “Unknown”, and so on. Every figure, the chart, and every table then count only the visits that match. Custom events cannot be used as filters yet.
- A filter by a table row keeps exactly the visits that row counted.
- A filter by a page keeps the visits with a pageview of that path, and counts all their pages. So a filter by
/pricingshows what else the visitors who saw the pricing page looked at. - Several filters must all match.
Active filters show in the filter bar, each with a button to remove it, and “Clear filters” removes them all. Filters are in the page’s address, so you can link to a filtered view, reload it, and leave it with Back. A new period keeps the filters. Switching to another project keeps the period but drops the filters, because a page or campaign belongs to one project. When nothing matches, the page says so and offers to clear them.
When there is nothing to show
Section titled “When there is nothing to show”- A project without any events shows how to install the snippet. See Create a project and add the tracker.
- A period without events offers the last 12 months.
- A period without events in another environment than
productionnames the environment and suggests another. - If a load fails, the last numbers stay on the page, with the error and a Retry button.
On a phone
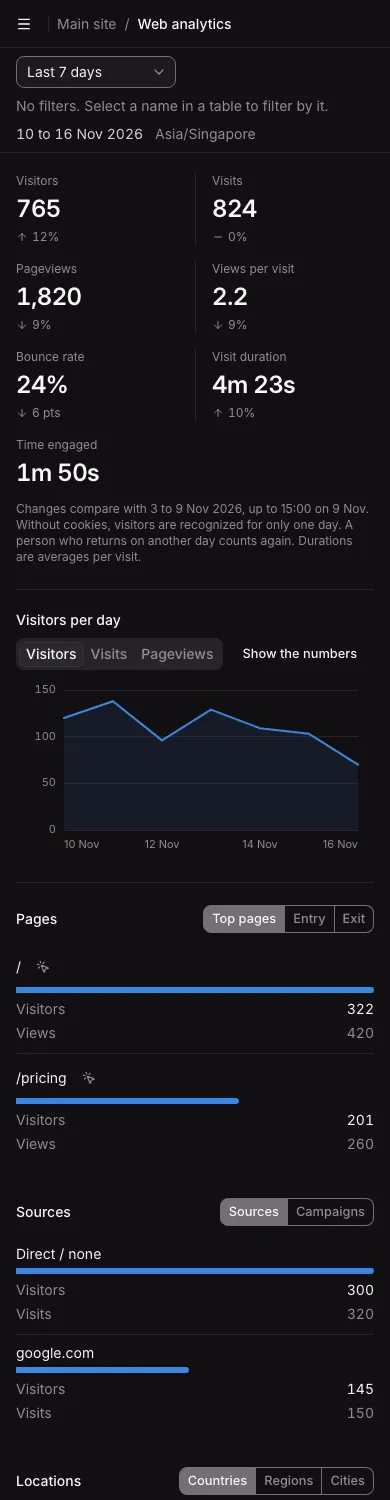
Section titled “On a phone”On a phone the figures sit two to a row, and each table row stacks, with its numbers labelled. See On a phone.
Not available yet
Section titled “Not available yet”- Hourly detail for one day.
- A comparison in the chart and the tables. Only the figures are compared.
- Custom events and event properties as filters on this page.