Services
The Services page counts the requests your servers handled, for each service and each of its routes: how many, the share that failed, how long they took, and their status codes. The numbers come from the traces your servers send (Send telemetry). Nothing else needs to be set up.
Open Services in the project’s menu, after Metrics. You need view access to monitoring (Members and roles). The Services pages are reports, with the period and the environment in the filter bar at the top (Reports).
What counts as a request
Section titled “What counts as a request”- A request is a span of kind
SERVER. - Its route is its
http.routeattribute, or the span’s name when it has none.GETandPOSTof onehttp.routecount as one route. - A request failed when its span’s status is Error.
- Its status class (2xx, 3xx, 4xx, or 5xx) comes from its
http.response.status_codeattribute, or the olderhttp.status_code. A request without either, or with a code outside 200 to 599, counts as No status. - A status class is a count, not a failure: a 404 is not failed unless its span’s status is Error.
- The median, 95th, and 99th percentile are exact, from the requests’ durations.
The Services page
Section titled “The Services page”At the top, a chart shows every service’s requests over the period. The buttons beside its title choose what it draws:
- Requests: requests per second, a line for each status class, in the same colours as the rest of the page;
- Failed: the share of requests that failed, from 0 to 100%;
- 95th percentile: the 95th-percentile duration.
Hover the chart, or use the arrow keys on it, to read a moment. Show the numbers opens the data as a table. The chart loads apart from the list: if it fails, it says so with Retry, and the list below still shows. A chart over several days keeps the same length of time per point at every time of day, such as an hour for 7 days.
Below the chart, a legend names the status classes and their colours. Then each service has a section, the busiest first.
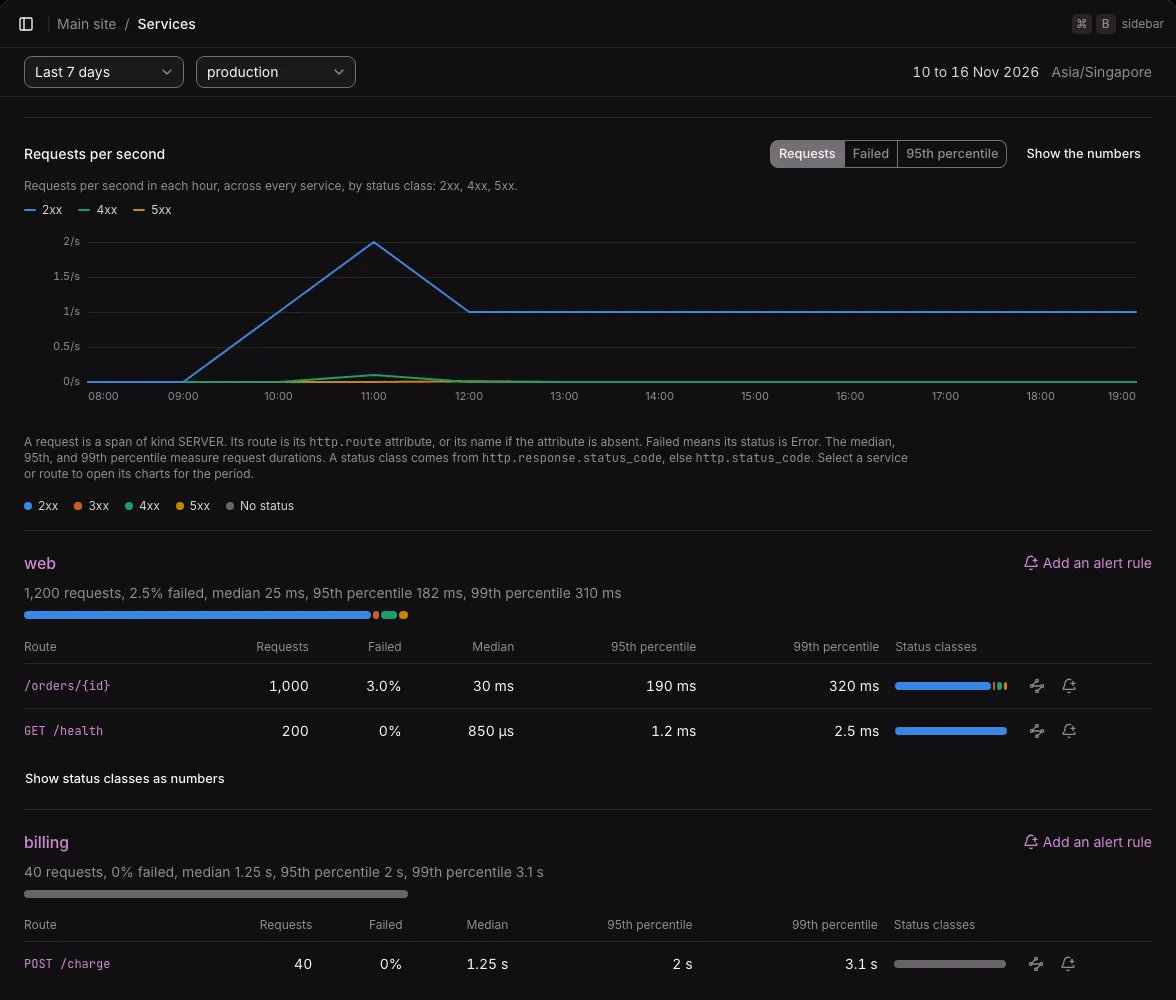
- The service’s line gives its requests, the failed share, and its median, 95th, and 99th percentile duration, with a bar of its requests by status class.
- Its routes follow in a table, the busiest first, with the same numbers and a status class bar. Hover or focus a bar to read each class’s count and share.
- Show status classes as numbers, under a service, replaces the bars with a column for each class.
Each route has two links: one opens the Traces page filtered by the service and the route (“Traces of GET /health in web”), the other adds an alert rule for the route. The service’s own Add an alert rule link adds one for the whole service. See Alert rules.
The traces link finds root spans whose name contains the route. A route that is only ever a child span (behind a gateway, for example) finds no trace there.
A service’s or a route’s page
Section titled “A service’s or a route’s page”Select a service’s name, or a route, to open its page.
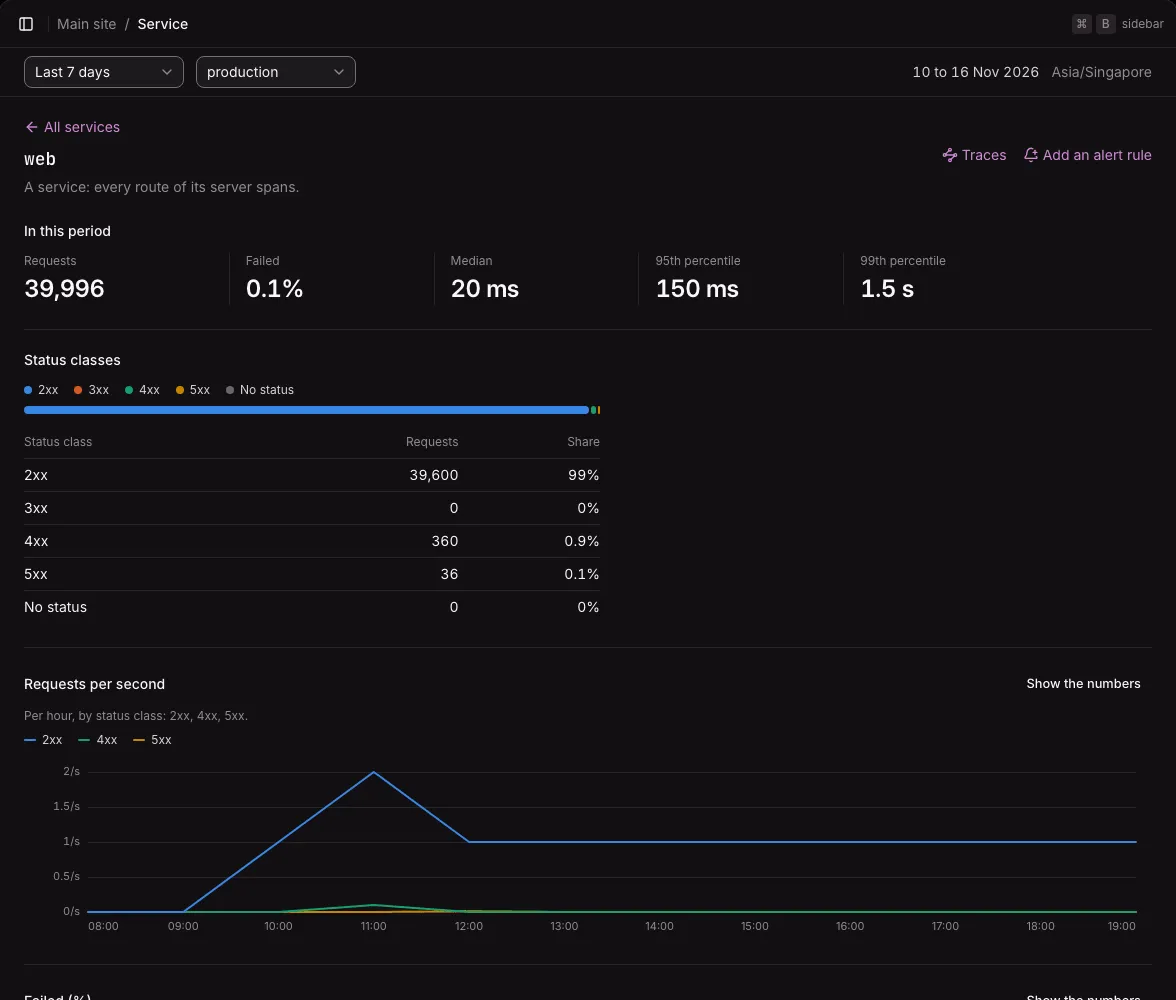
- In this period: requests, failed, median, 95th, and 99th percentile, the same numbers as on the Services page.
- Status classes: a bar and a table with each class’s requests and share.
- Requests per second: a line for each status class with a request.
- Failed (%): the failed share, from 0 to 100%. A gap means no request arrived.
- Duration (ms), or Duration (s) when the slowest reaches a second: the median, 95th, and 99th percentile.
Each chart has “Show the numbers”. Traces and Add an alert rule link to the service’s or route’s traces and to a new rule. A route’s page links back to every route of its service, and All services goes back to the list.
An alert’s link opens the Services page with only its service shown and its route marked, with a link to show all services.
When nothing shows
Section titled “When nothing shows”- No traces yet: while the project has sent no spans, the page shows the OpenTelemetry settings to copy, as the Traces page does.
- No requests in this period: spans arrived, but no request in the chosen period or environment.
- The page could not load: a busy instance answers that it cannot read now. The page says so and offers Retry. It does not retry by itself. A shorter period makes the read smaller.
Limits
Section titled “Limits”- The page lists up to 200 services, and each service’s 100 busiest routes. Past 100, a line says how many routes the service has.
- A route without a name, or a service named
.or.., shows as text, without its own page or alert rule link. - When a sender retries a batch, its spans can count two times for up to about an hour after the day’s last spans arrive. A retry is rare, and a copy barely moves a share or a percentile.