Logs
The Logs page lists the log records your servers sent over OpenTelemetry, newest first, and shows the record you select beside the list. To send logs, see Send telemetry.
Open Logs in the project’s menu, after Traces. You need view access to monitoring (Members and roles).
The list
Section titled “The list”The Logs page is a list and detail screen: the records on the left, the selected record on the right. The j and k keys select the next and previous record, and Esc clears the selection. The selection is in the address. The full description is in Lists and details.
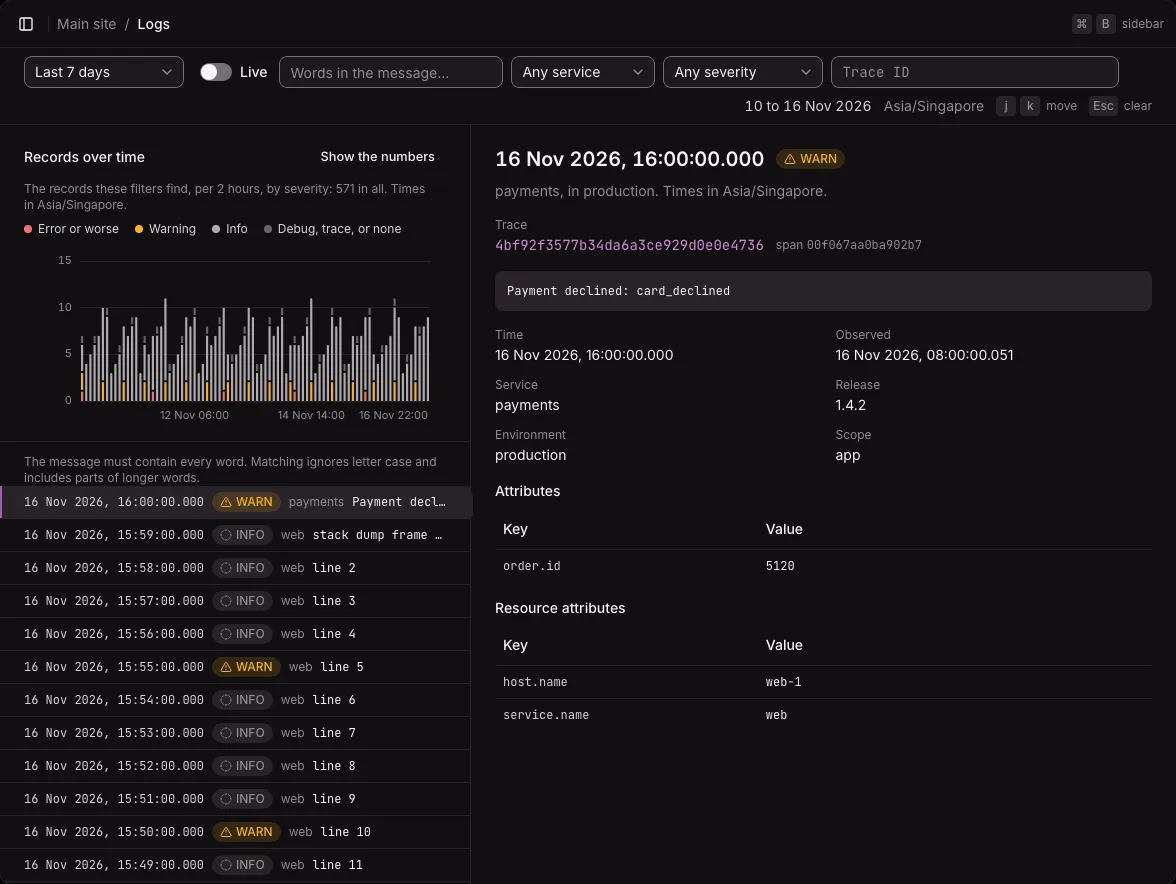
Each row shows, on one line, the record’s time, to the millisecond in the instance’s timezone, its severity, its service, and the start of its message, cut with “…” at the end of the row. On a phone, the message goes on a second line. Warning, Error, and Fatal records have a colored badge. The severity is the text the sender gave, or else the name of its severity range.
The list shows 50 records at a time. Load older logs adds the next fifty.
With nothing selected, the right pane sums up the records in the list: how many there are, how many are warnings, and how many are errors or worse (“at least” while older records are not loaded yet), the services of the period, and the latest error in the list.
Records over time
Section titled “Records over time”Above the list, a chart shows the records that the filters find over the period, as bars stacked by severity: Error or worse at the bottom, then Warning, Info, and Debug, trace, or none. Errors and warnings take the colours of their badges. The line under the title gives the length of a bar, the total, and the timezone.
- A bar’s length depends on the period: 2 hours for 7 days, 6 hours for 30 days, and a day for 90 days. A period of several days keeps the same length at every time of day.
- Bars start on the clock of the instance’s timezone, such as at midnight or 06:00. On a day when clocks change for daylight saving, one bar is an hour longer or shorter.
- Hover a bar, or use the arrow keys on the chart, to read its counts. Show the numbers opens the data as a table.
- Click a bar to narrow the period to that bar’s day, or days. The filters stay. A period of one day cannot be narrowed further.
The chart loads apart from the list. If it fails, it says “The chart could not load”, with Retry, and the list still works.
Turn on Live in the filter bar to watch records as they arrive, like tail -f.
- The period gives way to “Live”, and the chart is hidden. The environment, service, severity, words, and trace ID still apply.
- New records come in at the top, newest first. Records appear a few seconds after your servers send them, since senders send them in batches.
- The list does not move under you: while you pause it, scroll away from the top, or select a record, new records wait under a button, such as “12 new records”. Select it to add them.
- When too many records arrive at once, the list says how many it skipped. When Live comes back after a pause or a hidden tab of more than 5 minutes, it says which arrivals the list does not hold.
- Live keeps the newest 1,000 records, asks only while the tab shows, and stops after 15 minutes. Resume starts it again.
Turn off Live to search the period again, with your filters as they were.
Filters
Section titled “Filters”The filter bar holds the period and the environment, then four filters, each in the address:
| Filter | What it keeps |
|---|---|
| Words in the message… | Records whose message holds every word. It applies when you press Enter or leave the field. |
| Any service | The records of one service. |
| Any severity | Records at or above a severity: Trace, Debug, Info, Warning, or Error “and above”, or Fatal. Records without a severity are left out once you choose one. |
| Trace ID | The records of one trace: 32 hexadecimal digits. |
A filter keeps the selected record in the right pane, even when the new list leaves it out.
How words match
Section titled “How words match”- Each word must be in the message, in any case, as a whole word or as part of a longer one.
declinfinds “Payment declined”. - Words are split at every character that is not a letter or a digit. So
card_declinedis the two wordscardanddeclined, and each is matched on its own. - At most 8 words count.
- Searching for an exact phrase is not available yet: the words can be anywhere in the message, in any order.
A record
Section titled “A record”The selected record shows:
- its time and severity, its service and environment;
- its trace, a link that opens the trace in the Traces page on the record’s span, and its span ID;
- its whole message;
- its time and observed time, service, release, environment, event name, and instrumentation scope;
- its attributes and its resource attributes, as tables.
A record has no page of its own. On a narrow screen, a record opens in place in the list, and its trace link opens the trace’s page.
On a trace’s page, the trace’s records are listed under the waterfall, and a record’s span is a button that selects the span. See Traces.
When nothing shows
Section titled “When nothing shows”- No logs yet: while the project has sent no log records at all, the page shows the OpenTelemetry settings to copy, with this instance’s address and
sk_…in place of the key. The page never shows the key. - The page could not load: a busy instance answers that it cannot read now. The page says so and offers Retry. It does not retry by itself.
Limits
Section titled “Limits”- The list holds the first 1,000 characters of each message. The selected record shows all of it, up to the 64 KB a record keeps.
- Logs are kept for the instance’s telemetry retention, 30 days by default. See Send telemetry.
- Not available yet: searching for a phrase, and filtering by an attribute.