Metrics
The Metrics page lists the metrics your servers sent over OpenTelemetry, and a metric’s page charts it over the period. To send metrics, see Send telemetry.
Open Metrics in the project’s menu, after Logs. You need view access to monitoring (Members and roles). The Metrics pages are reports, with the period and the environment in the filter bar at the top (Reports).
The list
Section titled “The list”The list holds the metrics with points in the period and environment, by name.
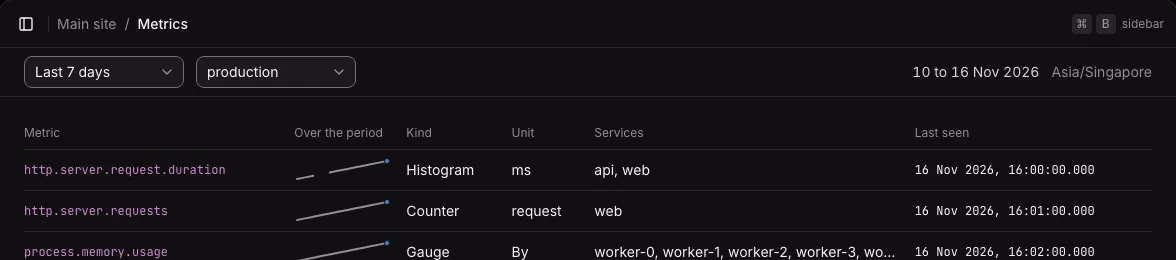
| Column | What it shows |
|---|---|
| Metric | The metric’s name, a link to its chart. A click anywhere on the row opens it too. |
| Over the period | A small line of the metric over the period, as its chart first shows it: a gauge’s average, an up-down counter’s total, a counter’s rate per second, or a histogram’s 95th percentile. The dot is the latest value. Hover it to read the lowest, highest, and latest values. |
| Kind | Gauge, Counter, Up-down counter, or Histogram |
| Unit | The unit the sender gave. An annotation such as {request} shows as “request”. |
| Services | Up to 10 services that send it, and how many more |
| Last seen | The time of its latest point |
A name sent as two kinds is listed two times. Past 1,000 metrics, a line says the list holds the first 1,000 by name.
The small lines are drawn for periods of up to 7 days; for a longer period, each row shows a dash. A line reads at most the 100 series with the most points, and says so when the metric has more. A row loads its line when it scrolls into view.
A metric’s charts
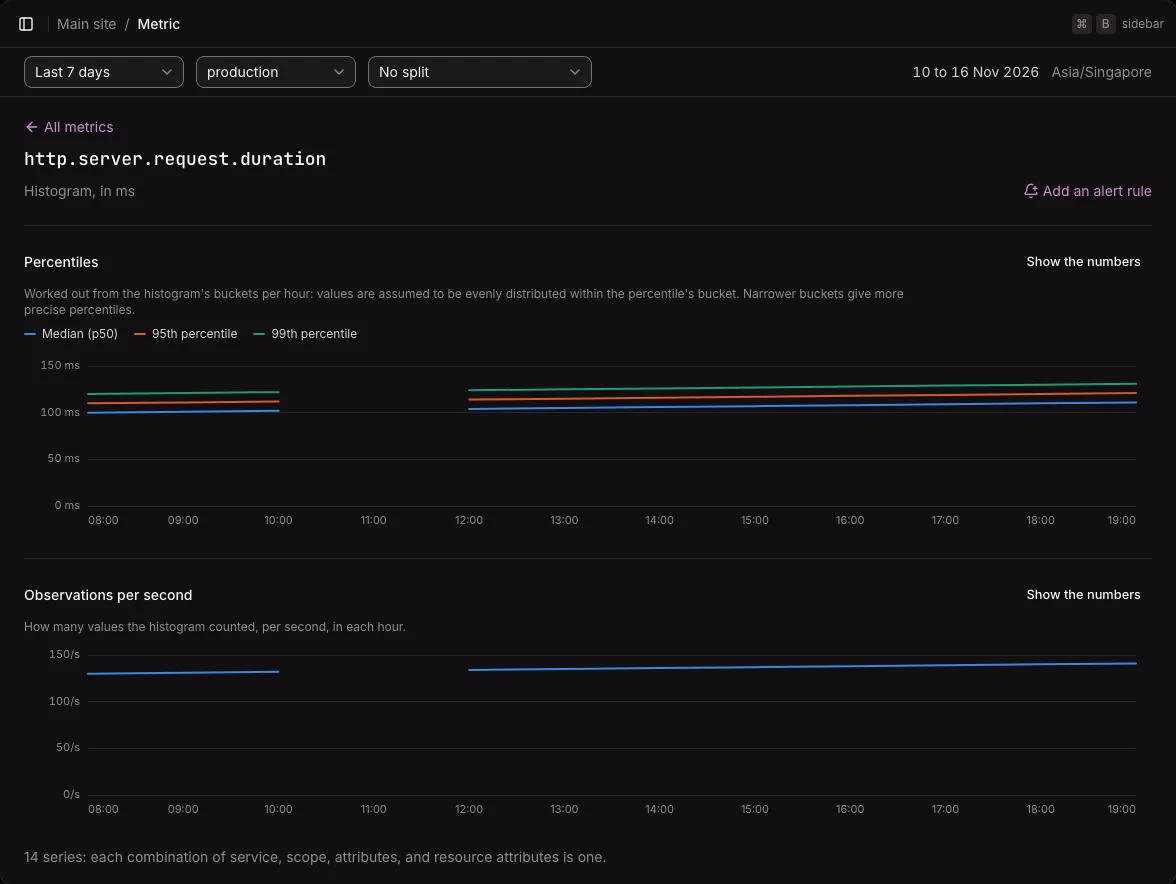
Section titled “A metric’s charts”A metric’s page shows its name, kind, and unit, then its charts over the period. Each chart has “Show the numbers”, which opens a table of every time bucket with a value.
| Kind | Chart |
|---|---|
| Gauge | Value: the average, minimum, and maximum of the points in each bucket |
| Counter | Per second: the rate of increase. A reset of the counter (a restart) starts a new count, and does not show as a drop. |
| Up-down counter | Total: each series’ last value in the bucket, added up, such as the connections open across all processes |
| Histogram | Percentiles: the median, 95th, and 99th percentile, worked out from the bucket counts. Then Observations per second, as a second chart, since it has another unit. |
Buckets get longer with the period: 5 minutes for a day, an hour for 7 days, 3 hours for 30 days. A chart of several days keeps the same bucket length at every time of day. Today’s chart starts with shorter buckets in the first hours after midnight. A gap in a line means no point arrived in that bucket.
Values read in the metric’s unit: durations in µs, ms, or s, bytes in KiB, MiB, and GiB, and rates with “/s”.
A histogram’s percentiles are estimates: a value is assumed to sit evenly within its bucket. Narrower buckets give closer percentiles. A histogram whose points carry no bucket counts has no percentiles, and still charts its observations per second.
Series
Section titled “Series”A series is one combination of a metric’s service, instrumentation scope, attributes, and resource attributes. A line under the charts says how many series were read. A chart reads at most 1,000 series, those with the most points, and says when it reached that limit.
Split by an attribute
Section titled “Split by an attribute”No split in the filter bar lets you choose one of the metric’s attribute keys. The chart then draws one line per value of that key, and points without the key as a line of their own.
- With more than 8 values, the 7 largest keep their lines and the rest are added up as “Other values”, in gray.
- For a gauge or a histogram, Measure chooses what each line shows: a gauge’s average, minimum, or maximum, or a histogram’s median, 95th, or 99th percentile.
- A value keeps its color while the page is open, even when the period or the measure changes.
The split and the measure are in the address.
Narrowed to a host or a value
Section titled “Narrowed to a host or a value”An alert’s link can open a metric’s chart for one host (its resource’s host.name) or one attribute value. The filter bar then lists each filter with a button that drops it, such as “Show every host”. Choosing these filters on the page is not available yet.
Add an alert rule
Section titled “Add an alert rule”Add an alert rule, beside the metric’s kind, opens the Alerts page with a metric rule filled in: the metric, its kind, the environment, and the host or value the chart is narrowed to. See Alert rules.
When nothing shows
Section titled “When nothing shows”- No metrics yet: while the project has sent no metric, the page shows the OpenTelemetry settings to copy, with
sk_…in place of the key. - No metrics in this period: points arrived, but none in the chosen period or environment.
- The page could not load: a busy instance answers that it cannot read now. The page says so and offers Retry. It does not retry by itself.
Limits
Section titled “Limits”- Exponential histograms and summaries are not supported. Histograms with more than 64 bucket bounds are refused. See Send telemetry.
- Histogram series with other bucket bounds than the most common ones are left out of the percentiles, and a line under the chart says so.
- Not available yet: splitting by a resource attribute or by service, charts of several metrics together, and choosing a period by selecting part of a chart.