Hosts
The Hosts pages show each server’s CPU, memory, filesystems, network, disks, and load. The data comes from the OpenTelemetry Collector on each server, with its host metrics receiver. Ottertrail stores these metrics as any other metrics, so the Metrics page can also chart each one alone.
The Hosts pages
Section titled “The Hosts pages”Open Hosts in the project’s menu, after Databases. You need view access to monitoring (Members and roles). The Hosts pages are reports, with the period and the environment in the filter bar at the top (Reports).
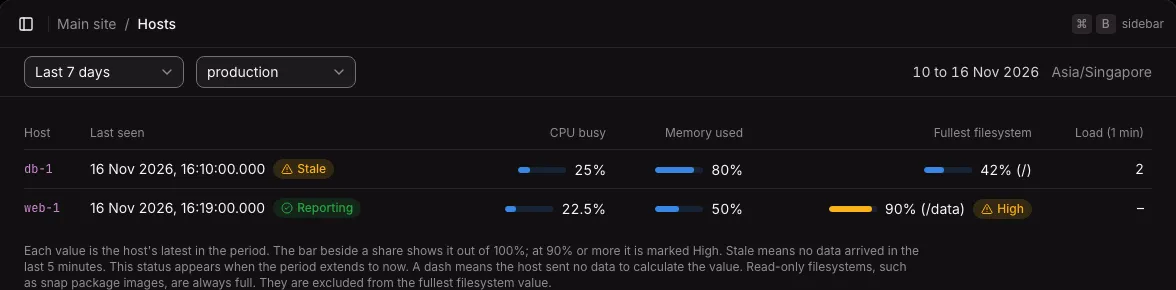
The Hosts page is a table of the hosts that sent host metrics in the period, by name.
| Column | What it shows |
|---|---|
| Host | The host’s name, a link to its page |
| Last seen | When its latest metric arrived, with a badge: Reporting, or Stale when nothing arrived in the last 5 minutes |
| CPU busy | The share of CPU time not idle, all CPUs together |
| Memory used | The share of memory used |
| Fullest filesystem | The fullest filesystem’s share used, with its mount point, such as “90% (/data)” |
| Load (1 min) | The 1-minute load average |
Each value is the host’s latest in the period. A dash means the host sent nothing to work it out from.
Each share has a small bar beside it, out of 100%. A share of 90% or more, as shown, is marked High: its bar takes the warning colour, and a High badge follows the figure. A click anywhere on a host’s row opens its page. For a period that ended before now, there is no badge: stale says something only about now. Past 500 hosts, a line says the table holds the first 500 by name.
A host’s page shows its name, when it was last seen and whether it is stale, then eight charts over the period, each with “Show the numbers”:
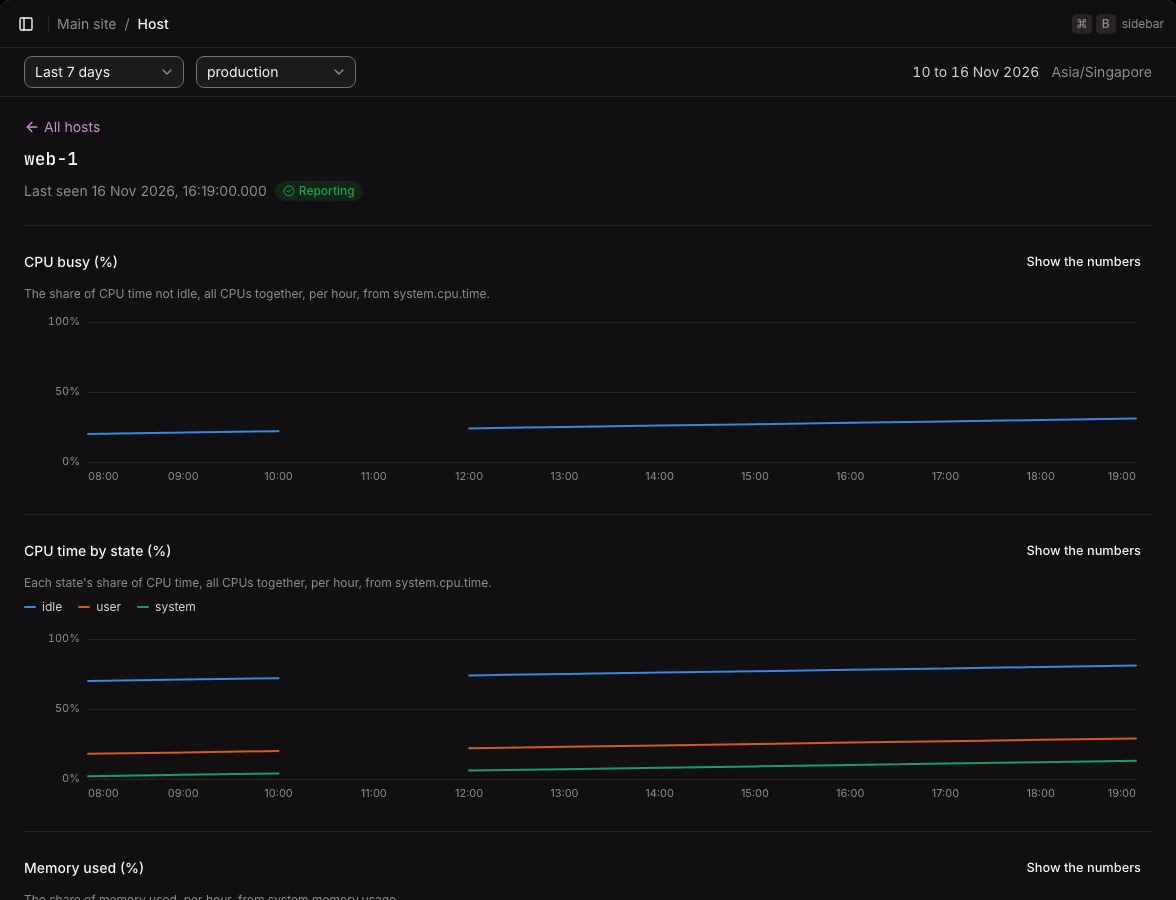
- CPU busy (%) and CPU time by state (%)
- Memory used (%) and Memory used (bytes)
- Filesystem used by mount point (%). Past eight mount points, the rest are one line, “Other mount points”.
- Network (bytes per second), Received and Sent
- Disk I/O (bytes per second), Read and Written
- Load average: 1, 5, and 15 minutes
Each chart says which metric it was worked out from, so you can tell whether the utilization metrics or the default ones were used. Percentages always run from 0 to 100. A chart the host sent nothing for says which metric it needs.
While the project has sent no host metrics from a named host, the Hosts page shows the Collector configuration below to copy, with this instance’s address and sk_… in place of the key.
Not available yet: sorting the table by a value, filtering hosts by name, and charts of swap, paging, disk operations, each CPU, each network interface, and processes. The Metrics page can chart each of these alone when the receiver sends it.
What the pages read
Section titled “What the pages read”- A host is the
host.nameattribute of the metrics’ resource. The Collector’s resource detection processor sets it. - Only metrics from the Collector’s host metrics receiver count. Host metrics that an app’s SDK sends do not appear as a host.
- A host shows as stale when nothing arrived from it in the last 5 minutes.
| Metric | Used for |
|---|---|
system.cpu.time, system.cpu.utilization |
CPU busy: the share of time not idle |
system.memory.usage, system.memory.utilization |
Memory used |
system.filesystem.usage, system.filesystem.utilization |
Filesystem used, for each mount point. Read-only filesystems are left out. |
system.network.io |
Network bytes per second, received and sent |
system.disk.io |
Disk bytes per second, read and written |
system.cpu.load_average.1m, .5m, .15m |
Load averages |
The utilization metrics are off in the receiver by default. Turn them on, as the configuration below does, so that the shares are exact.
Set up the Collector
Section titled “Set up the Collector”-
Install the OpenTelemetry Collector on the server. Use a distribution that has the host metrics receiver and the resource detection processor, such as the Collector’s contrib distribution.
-
Write this configuration. Put your instance’s address and the project’s secret key in the exporter:
receivers:host_metrics:collection_interval: 1mscrapers:cpu:metrics:system.cpu.utilization:enabled: truememory:metrics:system.memory.utilization:enabled: truefilesystem:exclude_fs_types:fs_types: [squashfs]match_type: strictexclude_mount_points:mount_points: ["^/snap/.*$"]match_type: regexpmetrics:system.filesystem.utilization:enabled: truenetwork:exclude:interfaces: ["^(lo|veth.*|docker.*|br-.*)$"]match_type: regexpdisk:exclude:devices:- "^(loop|ram|sr|dm-)[0-9]*$"- "^(sd|vd|xvd|hd)[a-z]+[0-9]+$"- "^(nvme[0-9]+n[0-9]+|mmcblk[0-9]+)p[0-9]+$"match_type: regexpload:processors:resource_detection:detectors: [system]system:hostname_sources: [os]batch:send_batch_max_size: 8192exporters:otlp_http:endpoint: https://analytics.example.comheaders:Authorization: Bearer sk_…service:pipelines:metrics:receivers: [host_metrics]processors: [resource_detection, batch]exporters: [otlp_http] -
Start the Collector with this configuration.
-
Open the Hosts page of the project. The server shows after its first export.
What the configuration does
Section titled “What the configuration does”- Component names. Newer Collector releases name the components with underscores:
host_metrics,resource_detection, andotlp_http. Older releases name themhostmetrics,resourcedetection, andotlphttp. Use the names that your release knows. - Utilization. CPU, memory, and filesystem shares come from the receiver’s own utilization metrics.
- Filesystems. Read-only snap images (
squashfs) and/snap/…mount points are left out. - Network. The loopback interface and container interfaces (
veth…,docker…,br-…) are left out. Only traffic in and out of the machine counts. - Disks. Loop, RAM, optical, and device-mapper devices, and partitions such as
sda1andnvme0n1p1, are left out. Each disk’s bytes count one time, from the whole disk. - Host name.
hostname_sources: [os]takes the operating system’s host name. - Batches.
send_batch_max_sizesets an upper limit on each request. Without it, one large batch can pass through whole. Keep it at 50,000 or less, so that a request fits in the project’s budget.
In a container
Section titled “In a container”When the Collector runs in a container, mount the host’s root filesystem into it, and give its path to the receiver with root_path, such as /hostfs. Without it, the receiver measures the container, not the host.
Keep the key safe
Section titled “Keep the key safe”The configuration file holds the secret key. Make the file readable only by the user that runs the Collector, or read the key from an environment variable in the configuration.