Heatmaps
Heatmaps show where visitors click on one page of your site and how far down they scroll. The Heatmaps report gives the figures for a page, a period, an environment, and a kind of device. Open on your site draws the same data over your live page, for you only.
Heatmaps are off by default. A page sends heatmap data only when the project’s setting is on and the tracker’s script tag asks for it.
What is recorded
Section titled “What is recorded”For each pageview that is recorded:
- Clicks, by element. Each click with the main mouse button or a tap, up to 100 a pageview. Clicks after the 100th are only counted. A click made with the keyboard has no position, so it is not recorded. For each click, the tracker sends:
- the element, as its place in the page: the tag names from the page’s body down to the element, with a number when the element has siblings of the same tag, such as
body>main>section:2>div>a; - the element’s name, when your site gave it one with
data-ottertrail-name(below); - where in the element the click fell, as a share of its width and height;
- the width and height of the window and the height of the page;
- whether the click was a rage click;
- the minute it happened. Times are kept to the minute, so the order of one visitor’s clicks within a minute cannot be read back.
- the element, as its place in the page: the tag names from the page’s body down to the element, with a number when the element has siblings of the same tag, such as
- Scroll depth. One value a pageview: the deepest point the bottom of the window reached, as a share of the page’s height. With it, the fold: the share of the page that showed without scrolling.
- Rage clicks. A click is a rage click when it is the third or later of 3 or more clicks within 1 second and 30 pixels of each other. Rage clicks often mean that something did not respond.
- The page. Its path, as for pageviews, and the environment and release of the script tag. In a single-page app, clicks and scroll depth belong to the path they happened on.
A click inside a link, a button, a form field, a label, or an element with a role such as button, tab, or checkbox counts for that element. So a click on a button’s icon counts for the button.
Only standard HTML and SVG tag names are sent. Any other tag, such as a custom element <user-card>, is sent as x, because a site’s own tag names can contain words.
What is never recorded
Section titled “What is never recorded”- The text of any element, and anything typed or chosen in a form.
id,class,href,src,title,alt,aria-*, and every other attribute, exceptdata-ottertrail-name.- Query strings (other than the UTM tags, as for pageviews) and fragments.
- A visitor ID or a session ID. A heatmap record cannot be linked to a visitor, a visit, or a user.
- Mouse movement. Ottertrail records clicks and scrolling only.
The tracker stores nothing on the visitor’s device for heatmaps: no cookies and no local storage.
Turn on heatmaps
Section titled “Turn on heatmaps”Two switches are needed, as for session replay.
1. The project’s setting
Section titled “1. The project’s setting”- Open the project’s Settings, and stay on the Install tab.
- Under Heatmaps, turn on Record clicks and scroll depth.
- Select Save changes.
Only the owner and admins can change project settings. The setting follows the save rule.
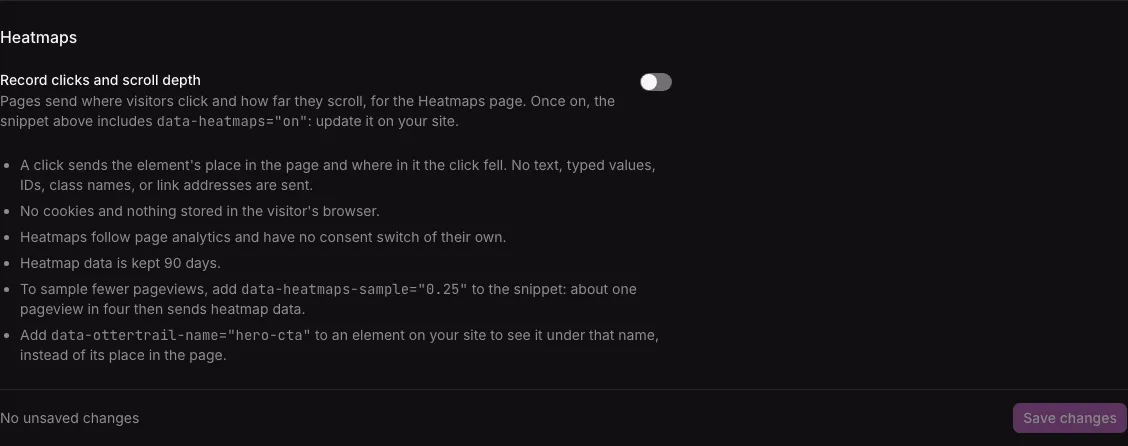
While the setting is off, the instance refuses heatmap data, and the page stops sending it until it is loaded again.
2. The script tag
Section titled “2. The script tag”Once the setting is saved, the snippet on the Install tab includes data-heatmaps="on". Put the new snippet on your site, or add the attribute to the tag you already have:
<script defer src="https://analytics.example.com/t.js" data-key="pk_…" data-host="https://analytics.example.com" data-heatmaps="on"></script>With the attribute, the tracker loads h.js from beside its own address, with the tag’s nonce when it has one. Copy setup prompt on the Install tab also tells a coding agent to add the attribute while the setting is on.
- If the script tag has an
integrityattribute, the tracker cannot loadh.js, and no heatmap data is recorded. The console says so. - The setting needs the tag, and the tag needs the setting. Neither works alone.
Sample fewer pageviews
Section titled “Sample fewer pageviews”Every pageview is recorded by default. To record a share of them, add data-heatmaps-sample with a value from 0 to 1:
<script defer src="https://analytics.example.com/t.js" data-key="pk_…" data-host="https://analytics.example.com" data-heatmaps="on" data-heatmaps-sample="0.25"></script>With 0.25, about one pageview in four is recorded. The tracker decides for each pageview on its own, a page change in a single-page app included, and keeps nothing about the choice: a reload decides again. A value outside 0 to 1 writes a warning in the console, and every pageview is recorded. A page outside the sample does not download h.js.
Naming elements
Section titled “Naming elements”A place in the page, such as … > section:2 > div > button, is exact but hard to read, and it changes when the page’s layout changes. Give the elements that matter a name of your own with data-ottertrail-name:
<a href="/signup" data-ottertrail-name="hero-cta">Start free</a><nav data-ottertrail-name="main-nav">…</nav>- The report lists clicks under the name. A click inside a named element counts under the nearest name above it, so a name on a menu groups the clicks on its links. The place below the name shows when you hover the row.
- A name has 1 to 64 letters, digits, spaces,
.,_,:,/, or-, and starts with a letter or a digit. The tracker ignores any other value. - The name is sent as you wrote it. Name parts of the page, such as
pricing-table, and never put personal data in a name. - Name what you want to read, such as calls to action, menus, and forms. You do not need to name every element.
Blocked and masked areas
Section titled “Blocked and masked areas”Session replay’s markers keep areas out of heatmaps too. A click inside an element with data-ottertrail-block or data-ottertrail-mask is not recorded at all, not even as a click on an outer element. Use them for areas where the place of a click says too much, such as a PIN keypad or a signature pad:
<div data-ottertrail-block> <!-- a PIN keypad --></div>data-ottertrail-unmaskdoes not bring clicks back inside a blocked or masked area.- The markers also work inside an open shadow root. The tracker cannot see inside a closed shadow root, so put the marker on its host element.
See Masking and privacy for what the markers do in replays.
Devices
Section titled “Devices”A page often has another layout on a phone, so the report shows one kind of device at a time. The tracker sorts each pageview by the width of the window, in CSS pixels:
| Device | Window width |
|---|---|
| Mobile | Under 768 pixels |
| Tablet | 768 to 1,023 pixels |
| Desktop | 1,024 pixels and wider |
All devices in the report adds them together.
How long data is kept
Section titled “How long data is kept”Heatmap data is kept for 90 days, whatever the project’s setting for events. Older clicks describe an older layout of the page. The report reads at most the last 90 days: a period that begins earlier starts at the first day kept, and the report says so.
Deleting a project deletes its heatmap data. Deleting spam visits does not reach heatmap data, which has no visitor ID: it leaves with the 90 days.
Consent
Section titled “Consent”Heatmaps follow page analytics: they have no consent setting of their own. This is how Ottertrail is built:
- Nothing is stored on the visitor’s device.
- A heatmap record holds less than a pageview: no visitor ID, no text of the page, and no address beyond the path.
- Session replay is different, because it records what was on the screen. It can wait for the visitor’s consent. See Turn on session replay.
This describes Ottertrail’s design. It is not legal advice, and it does not say what the law requires for your site. Check your own obligations. If your privacy notice describes your analytics, it can say that they include clicks and scrolling.
The Heatmaps report
Section titled “The Heatmaps report”Open a project, then Heatmaps in its menu, after Speed. To see it, a member needs the web analytics area at View. See Members and roles.
The page is a report, laid out as the other reports are (Reports). The filter bar holds the period, the environment (once there is a choice), the page, the device, and the days with the instance’s timezone.
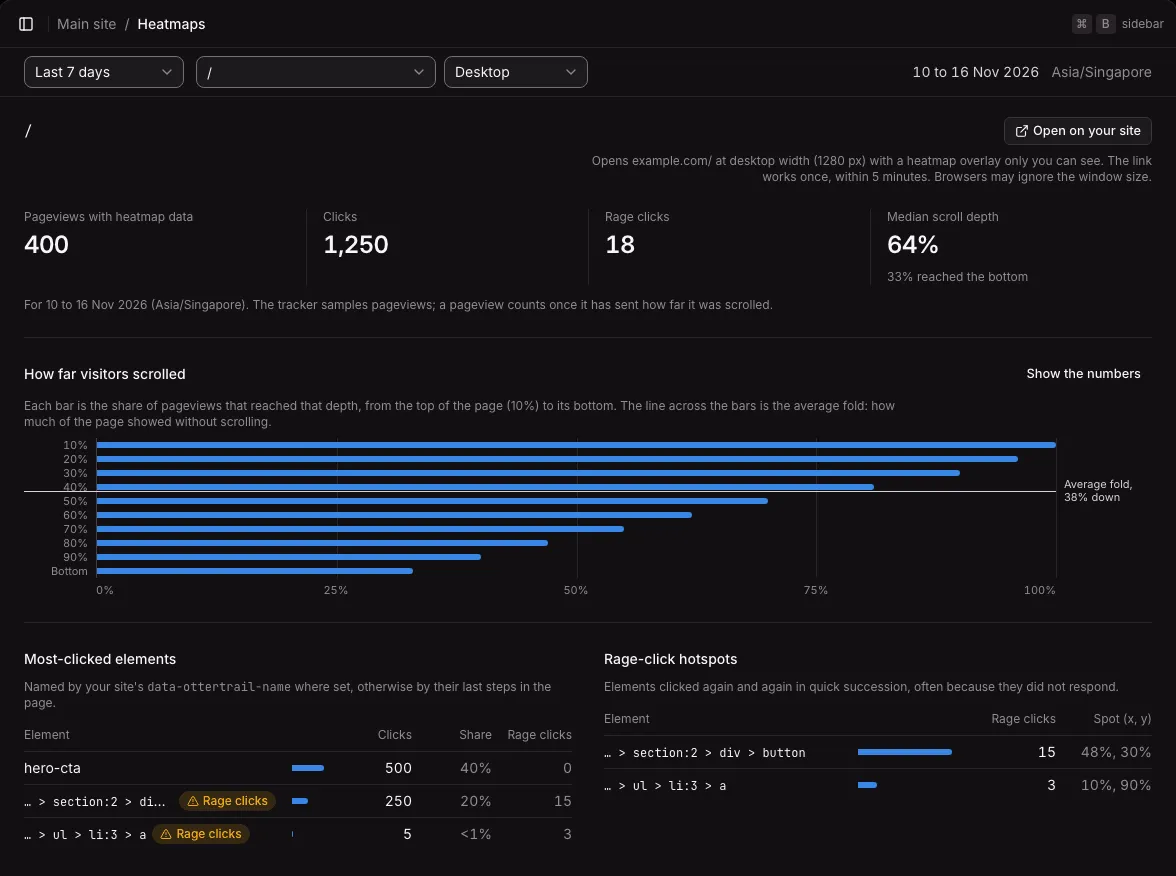
- The page. The picker lists the pages with heatmap data in the period, most first, up to 100. Type part of a path to search all of them. Without a choice, the report shows the first page with data.
- The device. Desktop, Tablet, Mobile, or All devices. Without a choice, the report shows the device with the most pageviews for that page and period. Your own choice stays when you change the page or the period, and goes in the page’s address.
- The figures. Pageviews with heatmap data (the pageviews that sent a scroll depth), Clicks, Rage clicks, and Median scroll depth, with the share of pageviews that reached the bottom. When a pageview passed 100 clicks, a line says how many clicks were not recorded. There is no change from the period before.
- How far visitors scrolled. A bar for each tenth of the page, from the top (10%) to the bottom, as long as the share of pageviews that reached it. A line across the bars marks the average fold: how much of the page showed without scrolling. Show the numbers opens the data as a table.
- Most-clicked elements. Up to 100 elements, most clicks first: the element’s name or the last steps of its place in the page, its clicks, its share of all the page’s clicks in the period, and its rage clicks. An element with rage clicks has a Rage clicks badge.
- Rage-click hotspots. Up to 20 elements with the most rage clicks, and the spot inside each that was clicked on average, such as “48%, 30%”: 48% across and 30% down.
Scroll depth arrives when a visitor leaves the page, and clicks arrive at once. So a period that includes today has a Today still arriving badge, and a page can show clicks before it shows a scroll depth.
On the Web analytics report, each row of the Pages table (Top pages, Entry, and Exit) has a small heatmap icon after its path. It opens the page’s heatmap for the same period and environment. See Web analytics reports.
When there is nothing to show
Section titled “When there is nothing to show”- The setting is off and nothing was collected: the page says that heatmaps are off. The owner and admins get Turn on heatmaps, which opens the Install tab. Members are told to ask an owner or admin.
- The setting is off, with data from before: the report shows, with a note that no new data arrives.
- The setting is on, without data in the period: the page reminds you to add
data-heatmaps="on"to the snippet, and that data arrives as visitors view pages. - A page or device without data: the page offers the devices and pages that have some.
- A failed load: the page says so, with Retry. A failed refresh keeps the last report.
On a phone
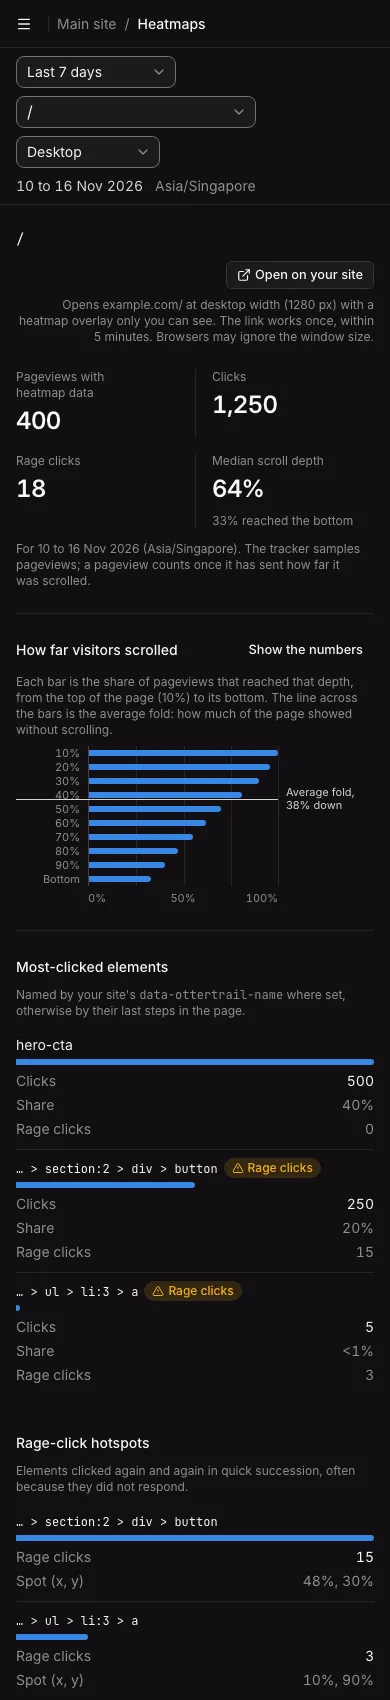
Section titled “On a phone”On a phone, the filters stack, the figures sit two to a row, and each table row stacks, with its numbers labelled.
Open the heatmap on your site
Section titled “Open the heatmap on your site”Open on your site, beside the page’s path, opens that page of your site in a new window, with the heatmap drawn over it. You see your page as it is now, with its real text, and the clicks over the elements they went to.

How to use it
Section titled “How to use it”- On the Heatmaps report, choose the page and the device.
- If the project has several allowed sites, choose the site in the Site list.
- Select Open on your site. A new window opens, as wide as the device shown: 1280 pixels for Desktop and for All devices, 820 for Tablet, 390 for Mobile. Browsers may ignore the size. The device mode of the browser’s developer tools gives an exact width.
- In the window, the panel shows the heatmap. Choose another period or device there if you like. Close the panel with ×, or press Escape inside it, to remove the overlay.
The line under the button names the address it opens and the width. Pages open with https. For localhost and 127.0.0.1, the page opens with plain http, and a Port field appears, because allowed sites have no port.
The page must be one of the project’s allowed sites and have the tracker on it. Without any allowed site, the report says to add your site’s hostname, with Add your site’s hostname for the owner and admins. See Project settings.
If the browser blocks the new window, the report says to allow pop-ups for the page and try again.
What you see
Section titled “What you see”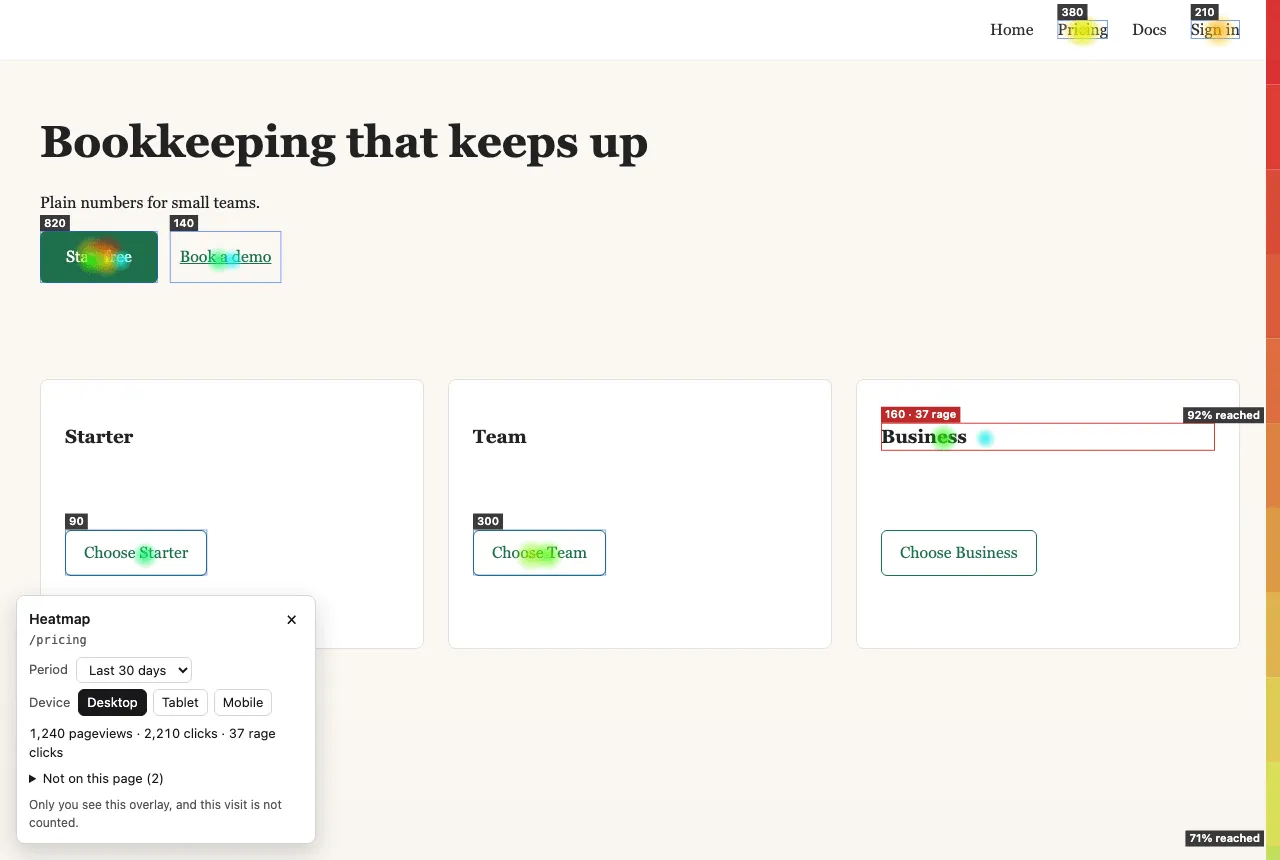
- Clicks. Each element in the report that the page has gets an outline, a label with its clicks and rage clicks, and coloured spots where in it the clicks fell. The spots show which part of the element was clicked, in a grid of 8 by 8, not single clicks.
- Scroll reach. A band down the right edge of the window, shaded by the share of pageviews that reached each part of the page, with the share written every 25%.
- The panel. The page’s path, the period (Last 7 days, Last 30 days, or Last 90 days), the device, the pageviews, clicks, and rage clicks, and Not on this page: the elements in the data that the page does not have now, with their clicks.
The overlay lets every click and scroll through to the page, so you can use the page as usual. It follows the page as you scroll, resize the window, or open a menu or a tab that adds or shows elements. It reads the environment of the tracker’s tag, data-environment, or production without one.
Your visit is not counted
Section titled “Your visit is not counted”A page opened from Open on your site sends nothing to Ottertrail for that page load: no pageview, custom event, error, Web Vitals, replay, or heatmap click. The panel says so: “Only you see this overlay, and this visit is not counted.”
- Other analytics tools on the page still count your visit.
- The tracker holds the page load’s events for up to 5 seconds, until the overlay’s answer. If the link proves not to be a valid one, the page load is counted as any visit, a few seconds late. If a valid link’s answer comes after the 5 seconds, what was sent by then stays counted, nothing more is sent, and the panel leaves out its note.
- Only you see the overlay. Visitors to the same page see nothing.
What the link can and cannot do
Section titled “What the link can and cannot do”The dashboard makes a link only when you select the button. The link carries a token in the address’s fragment (#ottertrail-heatmap=…). A fragment is never sent to a server, and the tracker removes it from the address as soon as it starts.
- It works once, within 5 minutes. After that, the panel says that the link expired or was already used. Open it again from the dashboard.
- The overlay then has a session of 30 minutes. It keeps the session in memory only. After 30 minutes, the panel says that the session ended.
- It ends when you sign out, when your password is reset, and when your dashboard session ends.
- It follows your access. Every read checks your role and areas again, as the dashboard does. If you lose the web analytics area or the project, the next read fails, and the panel says that your account cannot view the project’s heatmaps.
- It reads heatmap figures only: the clicks per element, the scroll reach, and the totals of the project’s pages. It cannot read keys, settings, events, replays, or anything about one visitor. The project’s public key plays no part.
- It works only on the project’s allowed sites. The instance answers the overlay only for a page on one of the project’s allowed hostnames.
A member with the web analytics area sees the project’s allowed hostnames on the Heatmaps report, so that Open on your site can name the site. Members still do not see the project’s settings.
If someone else uses a link before you, they get the session, and your window says that the link was already used. A link that reached the wrong person shows at most the heatmap figures of that project, for 30 minutes, while you may see them and stay signed in.
Limits
Section titled “Limits”- Redirects. Browsers keep the fragment across a redirect. If the page sends the browser elsewhere before the tracker runs, such as a page behind a login that redirects to an identity provider, the link goes to that other site. Open a page that loads without a redirect.
- A pinned tracker. If the script tag has an
integrityattribute, the tracker cannot load the overlay script,o.js. There is no overlay, and the page load is counted as usual. - Trusted Types. If the page requires Trusted Types for scripts, there is no overlay. The page load is counted after the tracker’s 5 seconds.
- Elements it cannot find. Elements inside frames or closed shadow roots, and content drawn on a canvas, are not found. An element that the page no longer has, after a redesign, in an A/B test, or for some visitors only, is listed under Not on this page. When two elements have the same name and place, the first is drawn.
- Changes it does not see. A menu that opens on hover only, or a CSS animation, can leave the outlines where the element was until the next scroll, resize, or change to the page.
- Scroll reach is for the whole document. A page that scrolls inside a box shows the document’s scroll.
- The wait. While the tracker waits for the overlay’s answer, it keeps the first 200 events of the page load. If you close the page during the wait, it sends them as any page does when it closes, within the browser’s limit of 64 KiB for those requests, so events with very long error stacks can be left out.
The Heatmaps report itself works on every site, whatever these limits.
Not available yet
Section titled “Not available yet”- A comparison with the period before.
- Dead clicks (clicks that change nothing), clicks followed by an error, and pages grouped by a pattern, such as
/products/*.